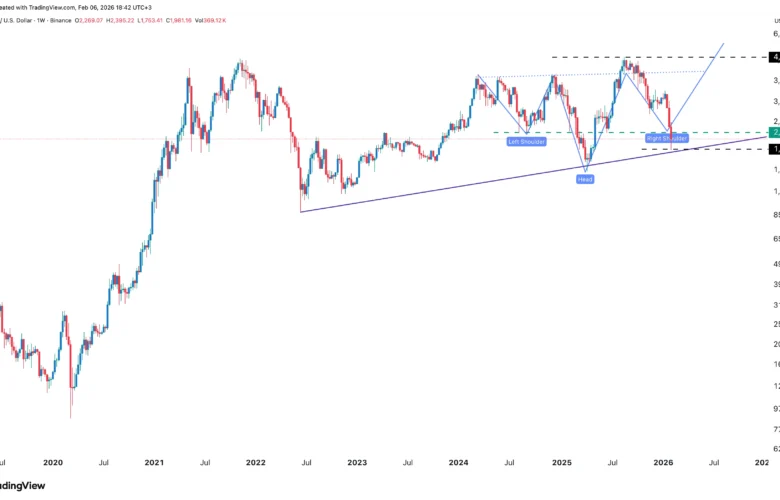
The weekly chart shows that ETH price has pulled back in the past few months. It has dropped from a record high of $4,950 to a low of $1,7686 today. Its lowest point was notable because it coincided with the ascending trendline connecting the lowest levels in June 2022 and April last year.
The price was also important because it was near the left shoulder of the inverted head-and-shoulders pattern. This pattern is one of the most common bullish reversal signs in technical analysis.
Therefore, a weekly close above $2,130 will point to a reversal, potentially to $3,000. On the other hand, a close below the support at $1,768 will invalidate the bullish outlook.